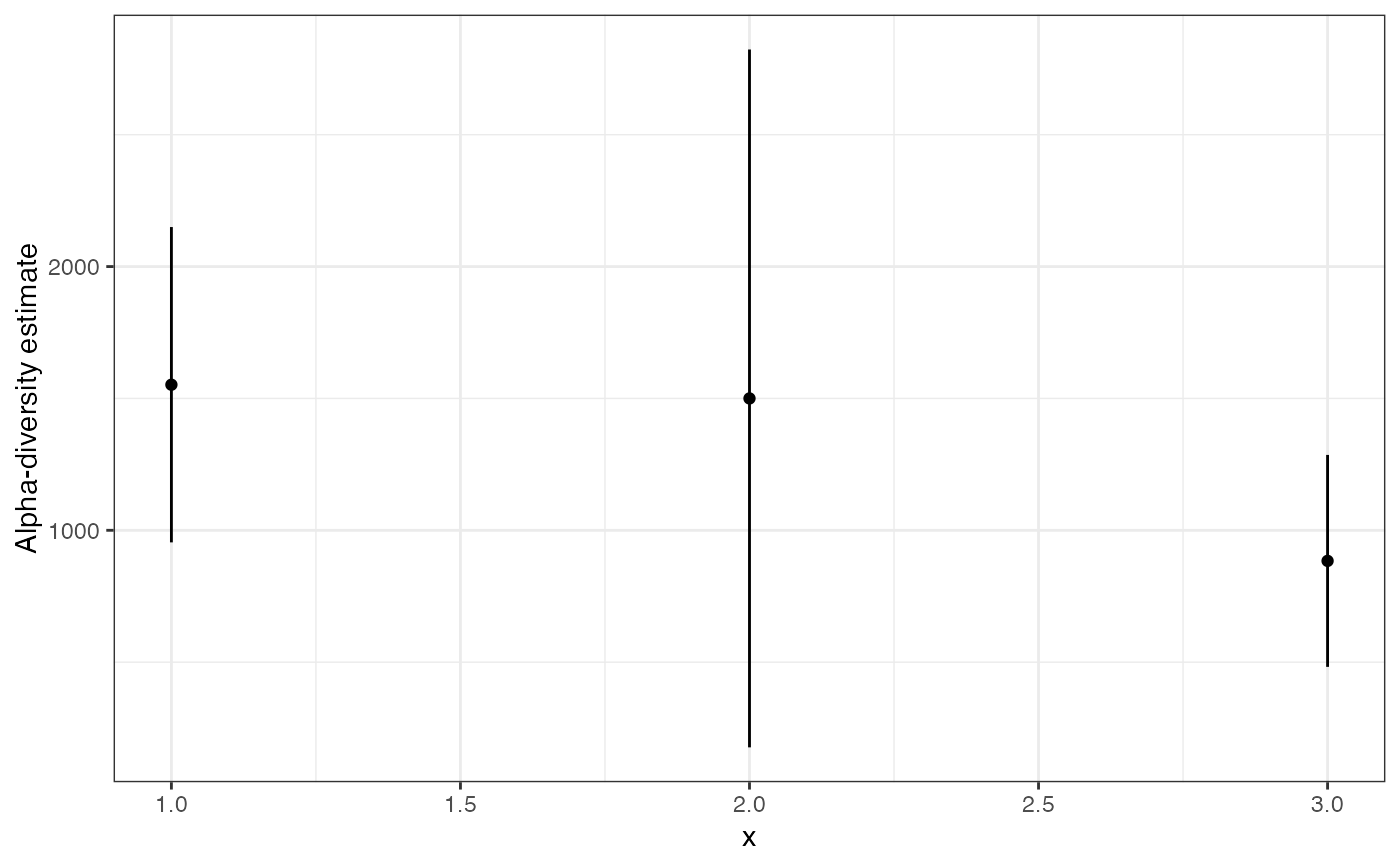
A simple plotting interface for comparing total diversity across samples or a covariate gradient.
betta_pic(
  y,
  se,
  x = 1:length(y),
  ylimu = NULL,
  myy = NULL,
  mymain = NULL,
  mycol = NULL,
  labs = NULL,
  mypch = NULL,
  myxlim = NULL
)
Arguments
- y
A vector of estimates of total diversity. Other parameter estimates are accessible; this method may be used for plotting any parameter estimates..
- se
The standard errors in y, the diversity (or other parameter's) estimates.
- x
A vector of covariates to form the x-coordinates of the intervals. If no argument is given, defaults to the order.
- ylimu
The upper endpoint of the y-axis.
- myy
Deprecated, for backwards compatibility
- mymain
Deprecated, for backwards compatibility
- mycol
Deprecated, for backwards compatibility
- labs
Deprecated, for backwards compatibility
- mypch
Deprecated, for backwards compatibility
- myxlim
Deprecated, for backwards compatibility
Value
A ggplot object.
References
Willis, A., Bunge, J., and Whitman, T. (2015). Inference for changes in biodiversity. arXiv preprint.